How to debug the Pro Mini XL or Atmega1284p using JTAG in PlatformIO
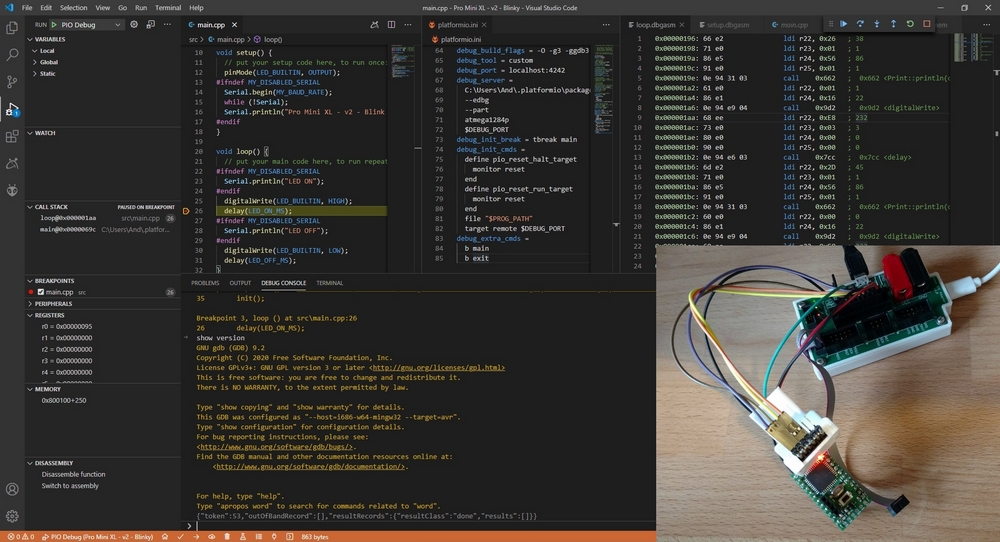
On-Chip AVR Debugging Options
The on-chip debugging options available for AVRs are typically constrained by the debug architecture of the chip, the debugger hardware and supported IDEs.
Typically, Atmel Studio is the preferred IDE option given it’s full support of AVR chips and debugging interfaces, such as JTAG, debugWire and PDI.
The Atmel ICE currently provides the widest AVR architecture support for debugging as well as IDE compatibility.
The MPLAB Snap also provides wide AVR architecture support for debugging but is currently only supported in Microchip’s IDEs.
Therefore, if you are able to use these IDEs with either debugging hardware, this would be the recommended method.
However, if you must, or would prefer, to use a GDB-compatible debugging IDE, such as PlatformIO, there is another albeit a not-officially-supported option.
AVaRICE is an open source software tool that can interface the Atmel ICE with GDB and is the option presented below.
PlatformIO: Adding a Custom Debug Tool
Following the steps below will enable PlatformIO to use an Atmel ICE to upload and debug code running on an ATmega1284p chip or Pro Mini XL board.
But if you would prefer to use another IDE that does GDB-based debugging, the downloaded tools (AVaRICE and AVR-GDB) remain the same.
It is assumed that PlatformIO has already been configured and is working with the ATmega1284p or Pro Mini XL.
If not, please follow the steps detailed here before continuing.
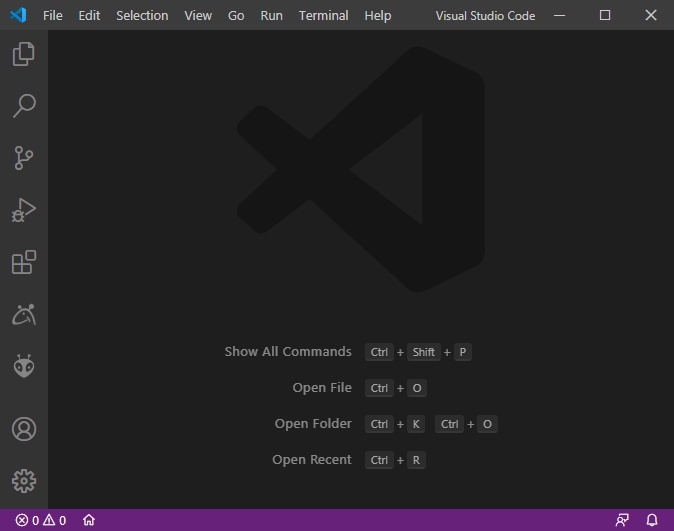
Step 1: Launch the VisualStudio IDE.
I’m using version 1.48 in the screenshots that follow.
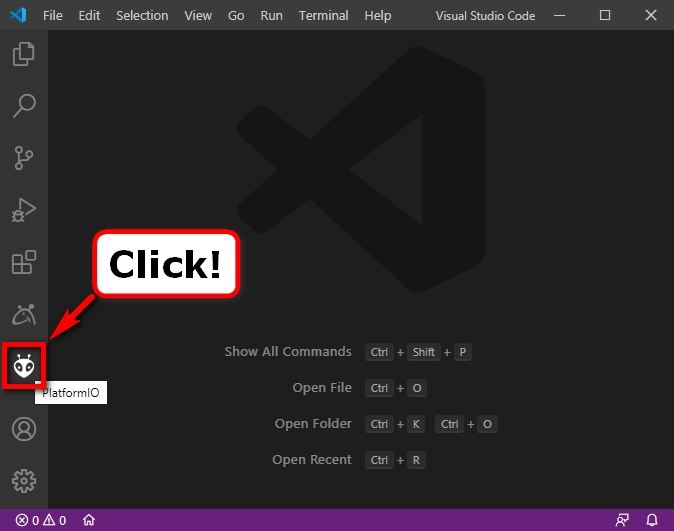
Step 2: Click on the PlatformIO button.
Note: If you haven’t installed PlatformIO yet, I recommend following the instructions in this tutorial.
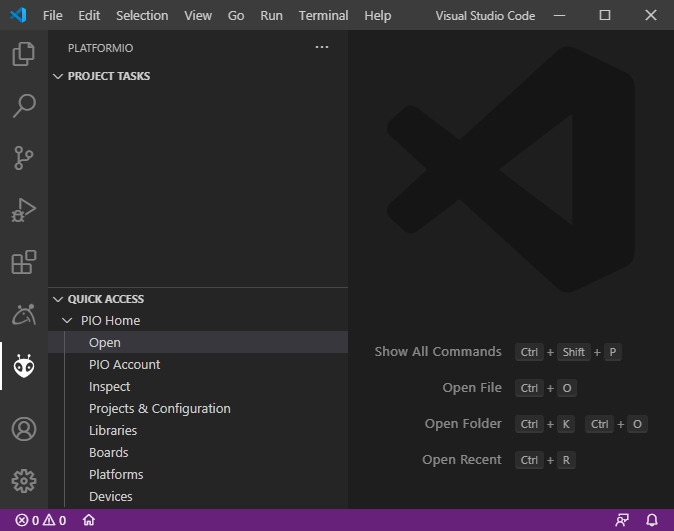
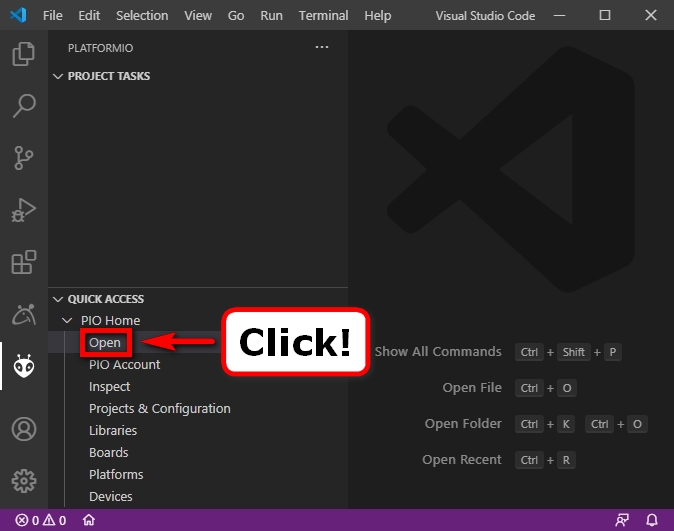
The following menu system should slide out of the left hand side of the main Visual Studio Code window:
Step 3: Select the “Open” option under the section called PIO Home from the QUICK ACCESS menu.
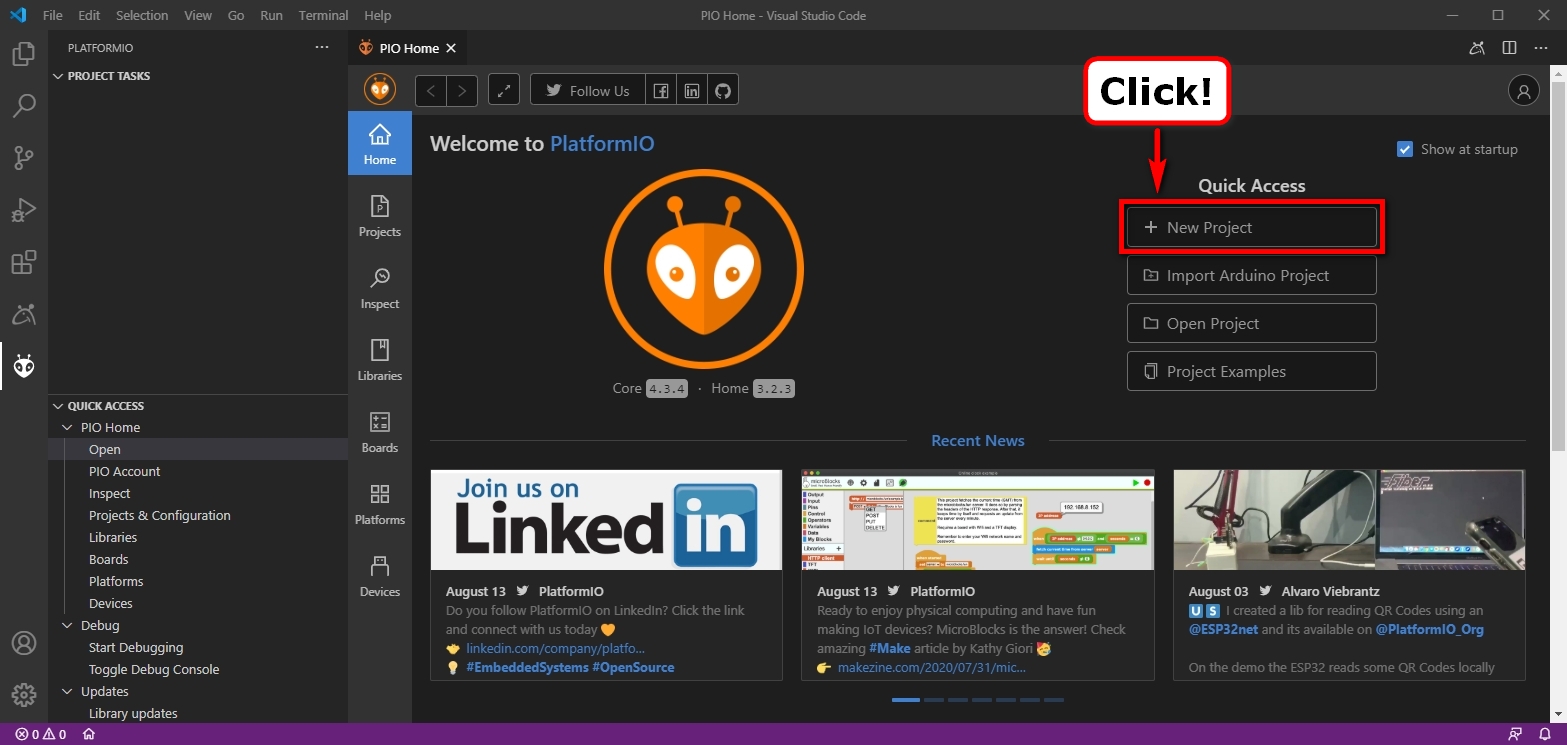
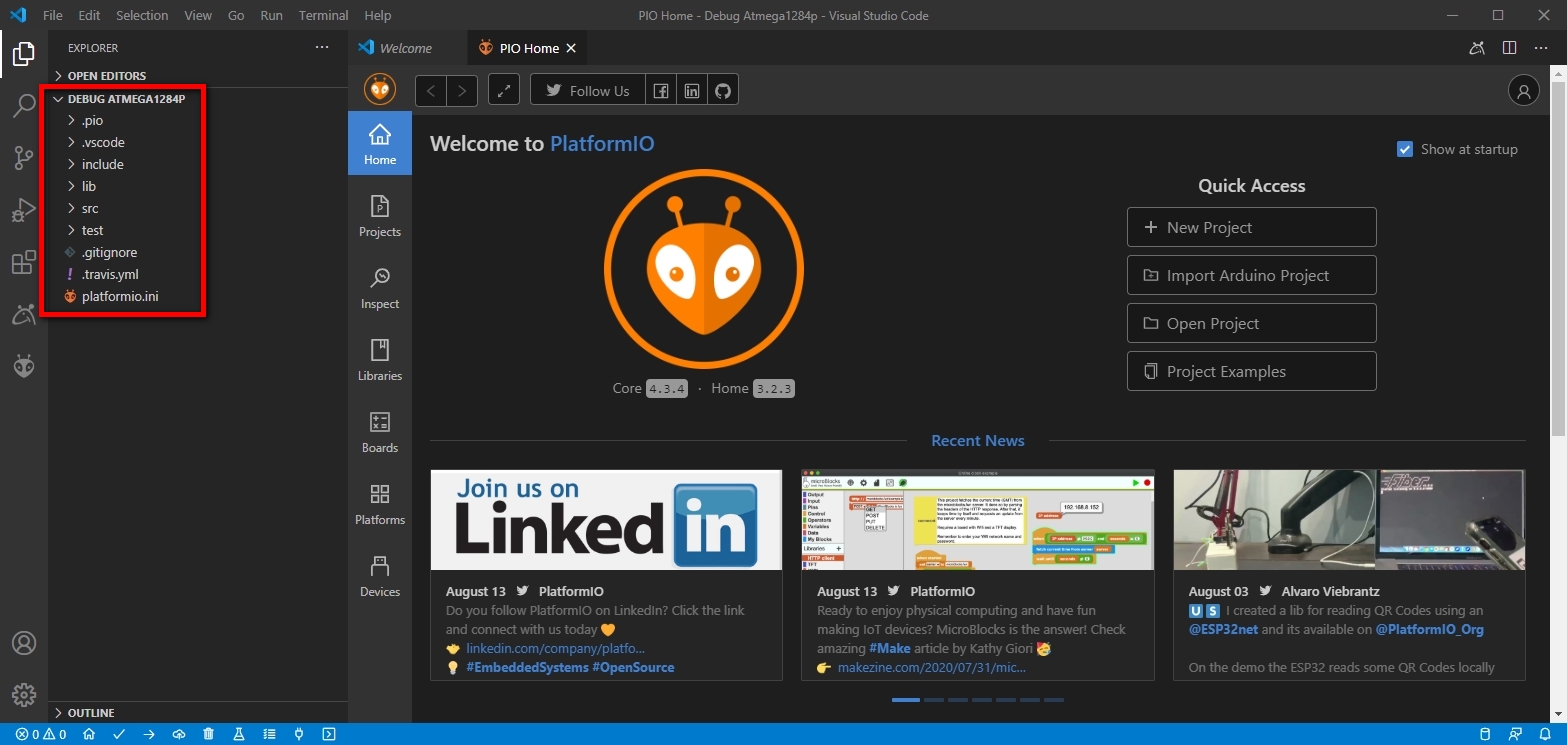
A new tab should appear with the PlatformIO home page displayed in the main Visual Studio Code window:
Note: Core version 4.3.4 and Home version 3.2.3 are shown below. Please let me know if the following steps cause issues for any newer versions.
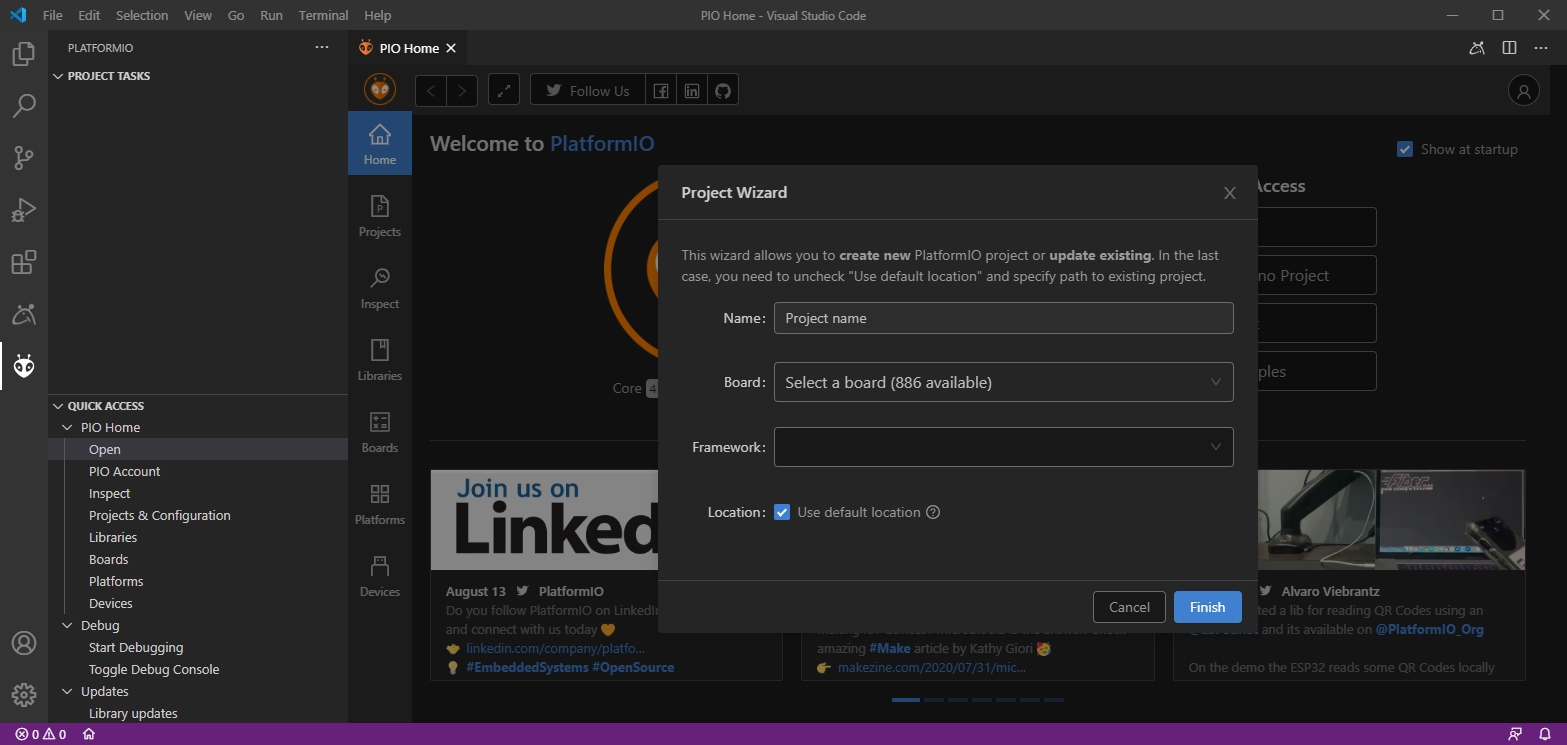
The Project Wizard window should appear allowing you to set-up your new project:
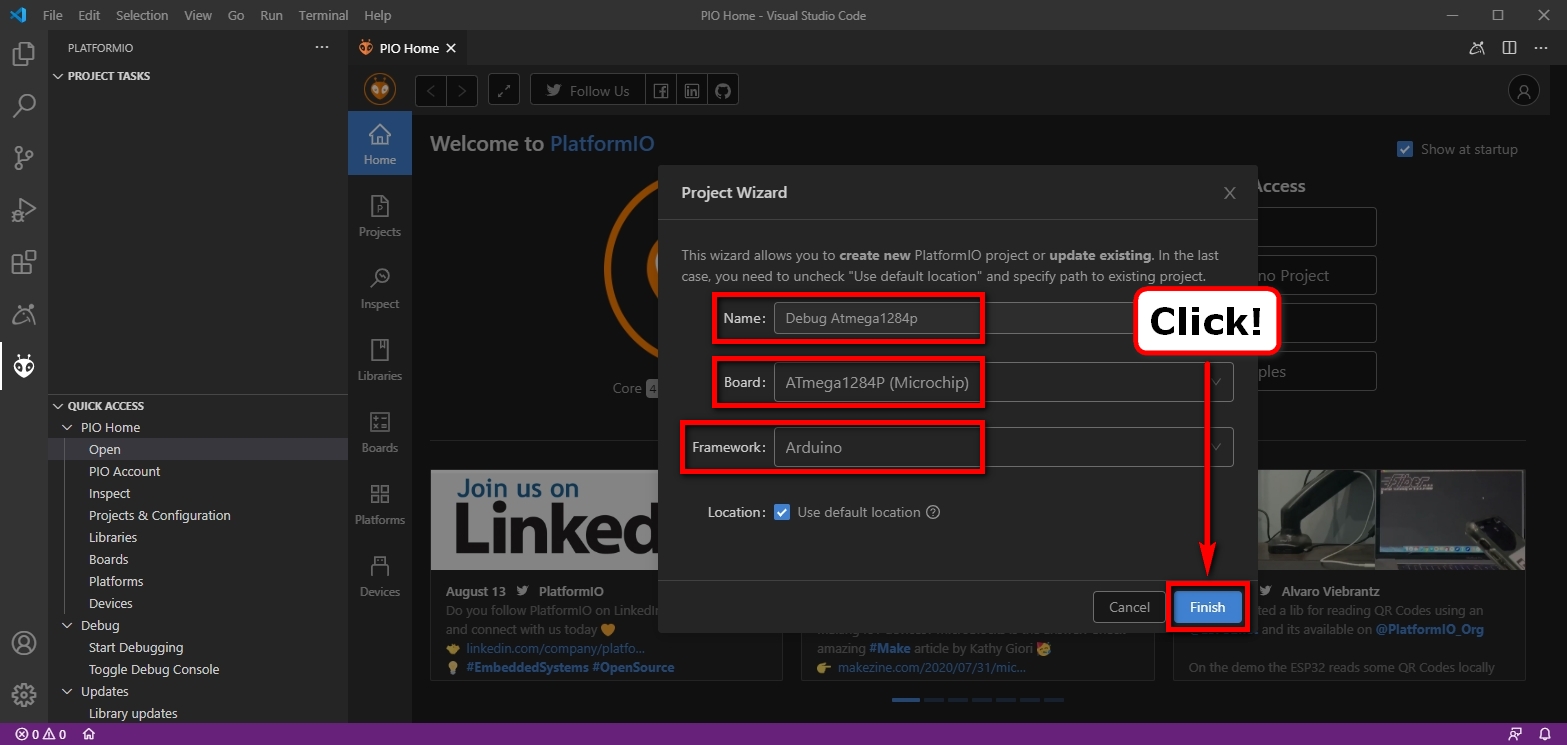
Step 5: Enter the following information for each entry in the Project Wizard window form.
The “Project name” can be anything you like – in the screenshot below, I’ve called mine “Debug Atmega1284p”. But for the other options, please select the following:Board: ATmega1284p (Microchip) [or, Pro Mini XL - v1/v2, if you created a custom board for it.]
Framework: Arduino
When you are done, click the “Finish” button.PlatformIO will now generate all the necessary project files and these files and directory structure should appear in the left hand workspace area.
Note: You can close the “Welcome” and “PIO Home” tabs if you like, by clicking the “X” next to their titles.
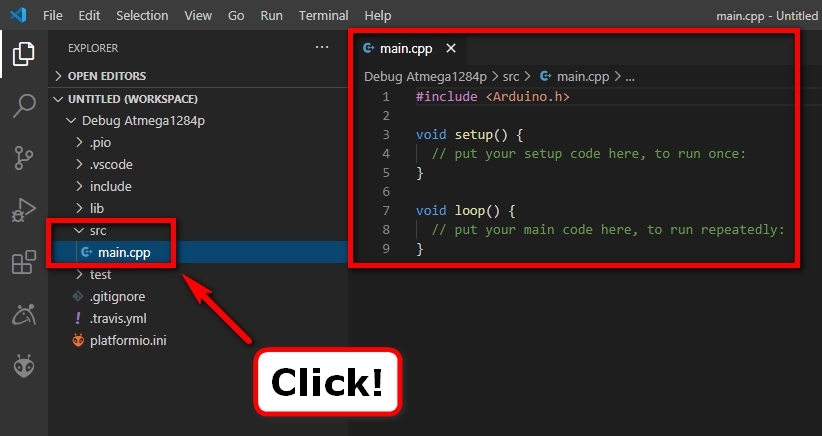
Step 6: Add some example code to debug in the main.cpp file under the src (Sources) directory.
Clicking the “> src” section in the left hand workspace area, expands to reveal the main.cpp file to click on.
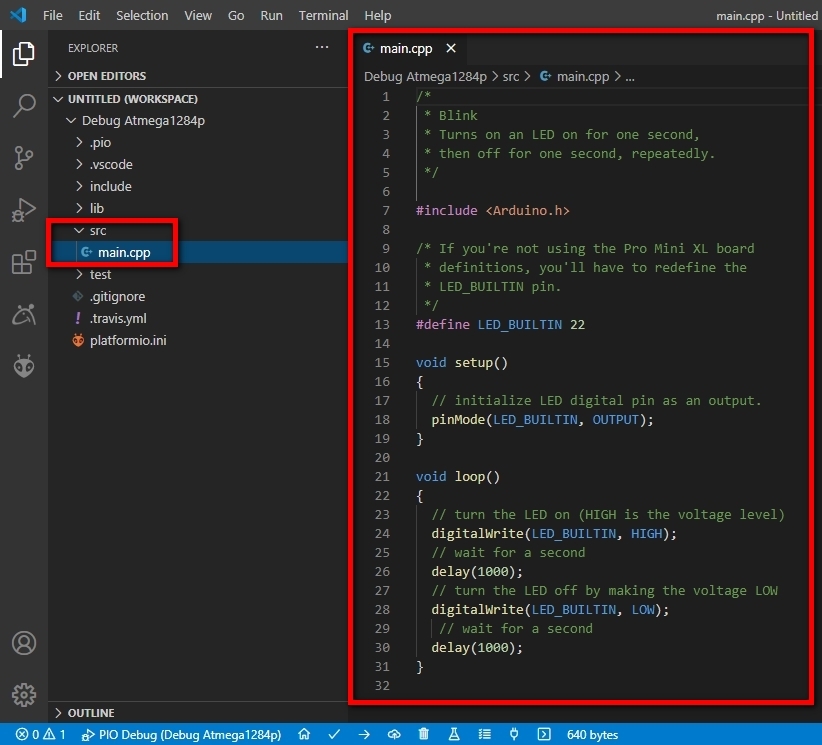
You can add any example code you would like to try debugging in the main.cpp file.
In the example screenshot below, I just added some simple blinky code.
Make sure you save the main.cpp file after you’ve finished editing it – just press Ctrl+S.
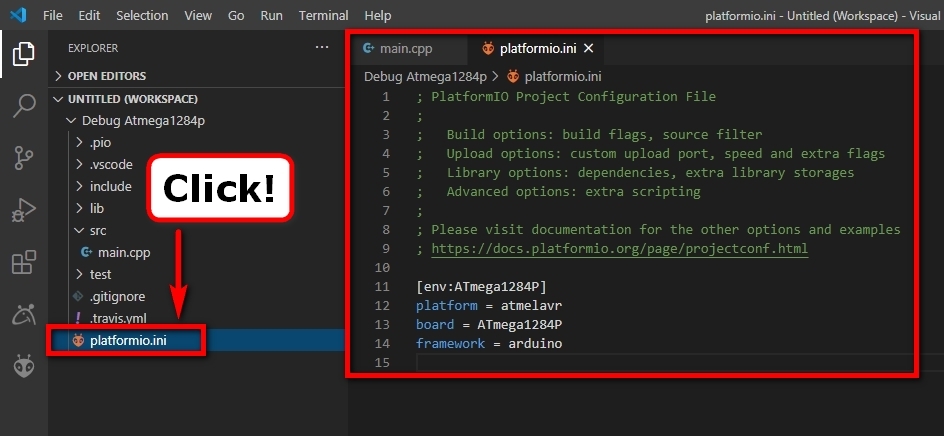
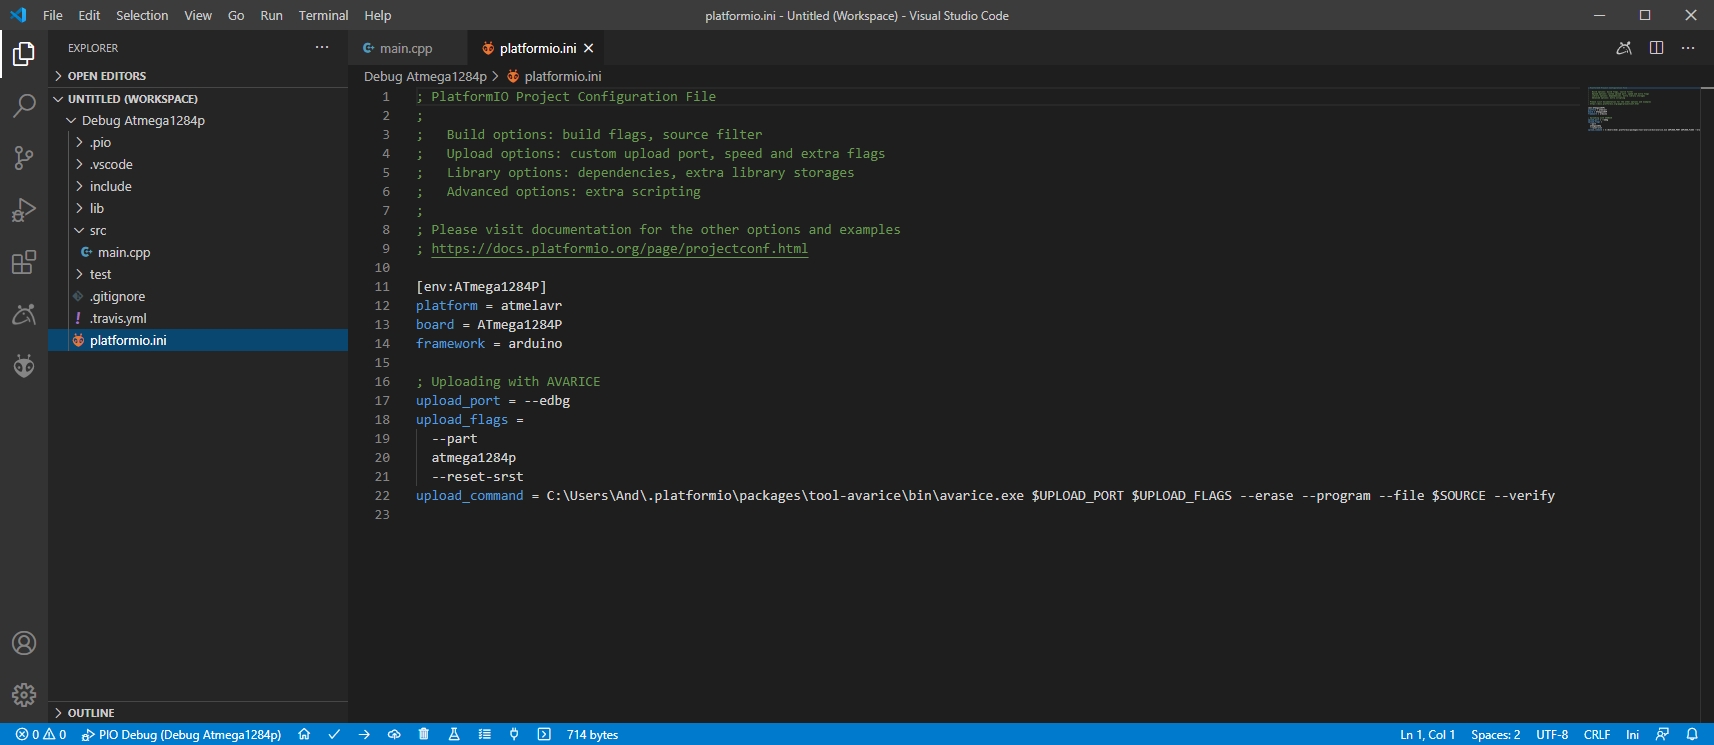
Step 7: Edit the platformio.ini file by clicking on the filename at the bottom of the left hand workspace area.
Add the following lines to the platformio.ini file:
; Uploading with AVARICE
upload_port = --edbg
upload_flags =
 --part
 atmega1284p
 --reset-srst
upload_command = C:\Users\[Your User Name Here]\.platformio\packages\tool-avarice\bin\avarice.exe $UPLOAD_PORT $UPLOAD_FLAGS --erase --program --file $SOURCE --verify
Make sure you save the platformio.ini file after you’ve finished editing it – just press Ctrl+S.
Step 9: Download the AVaRICE software and copy the executable to the directory detailed in the upload command above.
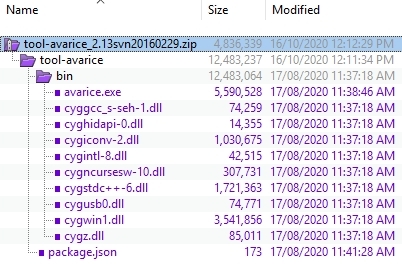
If you are using Windows and would prefer not to have to deal with Cygwin, you can download this ZIP archive which includes all the relevant Cygwin DLLs.
The ZIP archive contains the following files and internal structure:
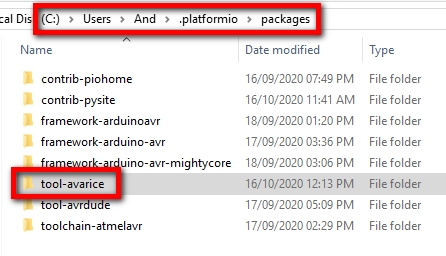
Extracting the above ZIP archive into the directory detailed in the upload command above, should create a new tools-avarice directory and associated files:
Note: The version of AVaRICE used in the following steps is a slightly modified v2.13svn20160229.
Step 10: Perform an upload test to verify the AVaRICE installation works with the Atmel ICE.
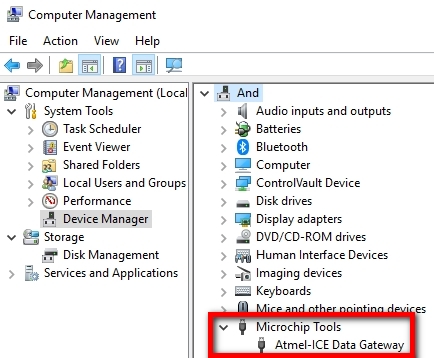
Ensure your Atmel ICE is plugged in and enumerated correctly as the appropriate USB device on your computer.
In Windows 10, this looks something like the following in Device Manager:
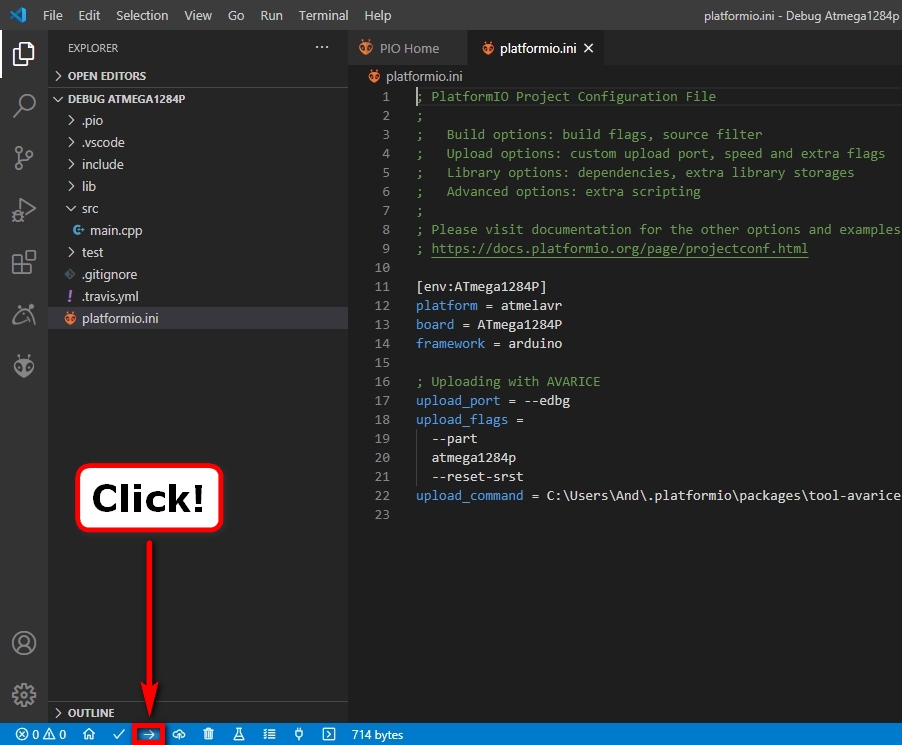
Click the upload button at the bottom of the Visual Studio Code window.
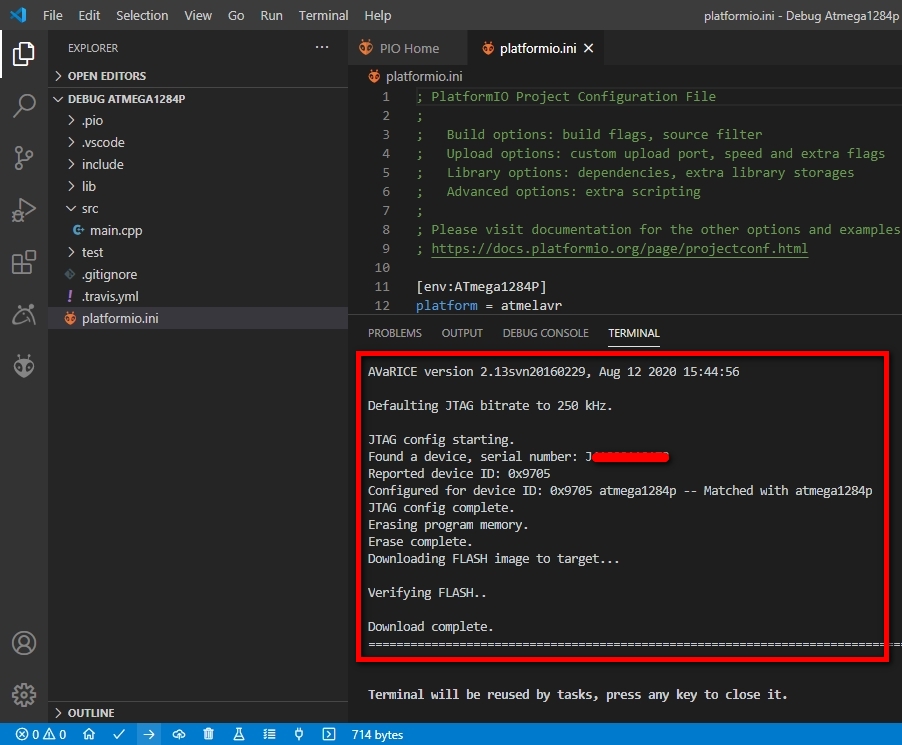
PlatformIO will now attempt to compile and upload your code through your Atmel ICE. If it’s successful, you should see something like the following:
Assuming the upload (referred to as a “Download” in the above message log) was successful, your code should now be running on your Atmega1284p.
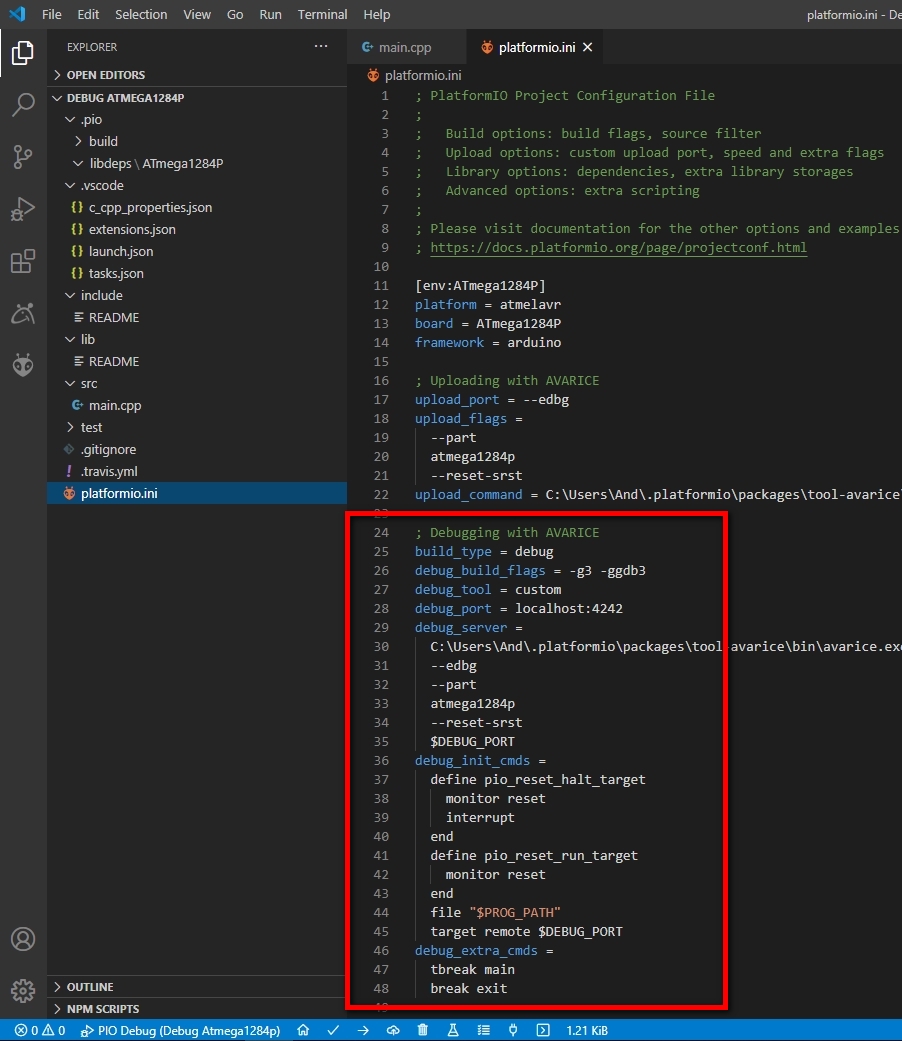
Step 11: Edit the platformio.ini file again and add the following lines:
build_type = debug
debug_build_flags = -g3 -ggdb3
debug_tool = custom
debug_port = localhost:4242
debug_server =
 C:\Users\[Your User Name Here]\.platformio\packages\tool-avarice\bin\avarice.exe
 --edbg
 --part
 atmega1284p
 --reset-srst
 $DEBUG_PORT
debug_init_cmds =
 define pio_reset_halt_target
 monitor reset
 interrupt
 end
 define pio_reset_run_target
 monitor reset
 end
 file "$PROG_PATH"
 target remote $DEBUG_PORT
debug_extra_cmds =
 tbreak main
 break exit
Note: The above configuration will automatically add breakpoints on the main and exit functions.
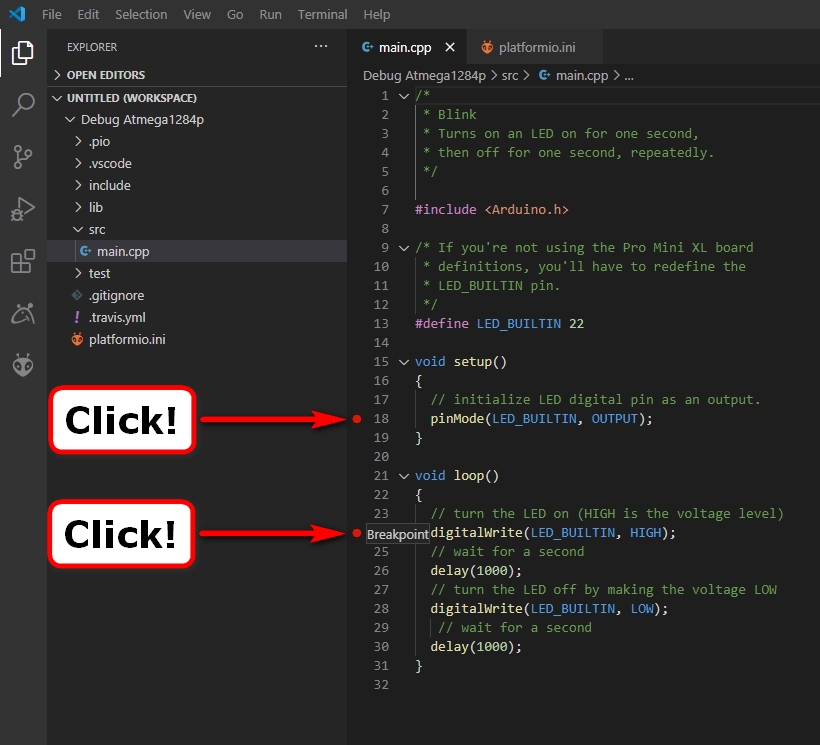
Step 12: Add any other breakpoints by clicking next to the corresponding source code line.
In the screenshot below I’m adding breakpoints on lines 18 and 24.
Before debugging, we now need to perform a few tasks through PlatformIO.
Step 13: Click on the PlatformIO button (as in Step 2).
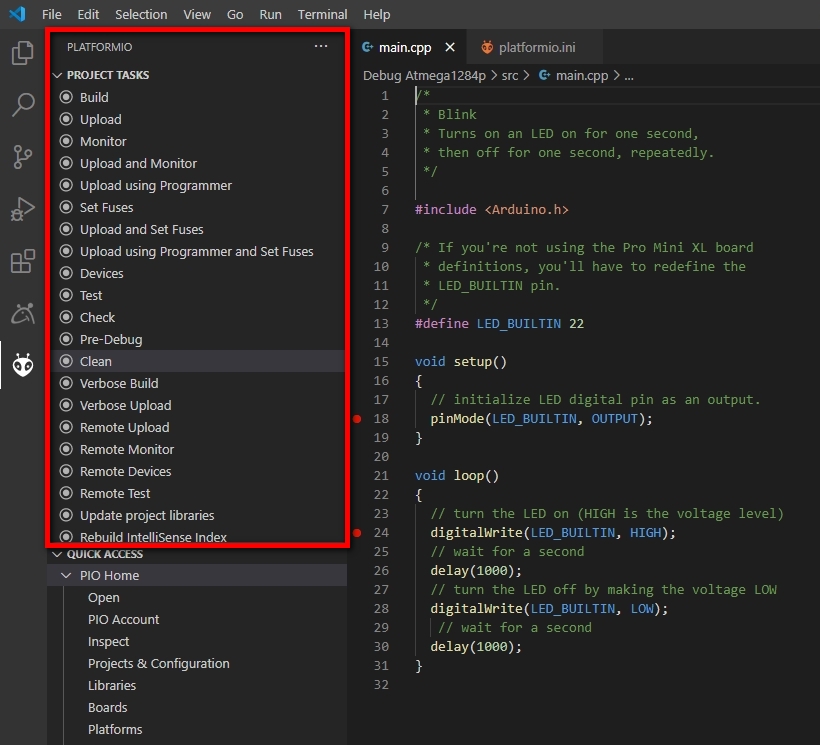
PlatformIO should display a list of available “PROJECT TASKS” that can be carried out by simply selecting them.
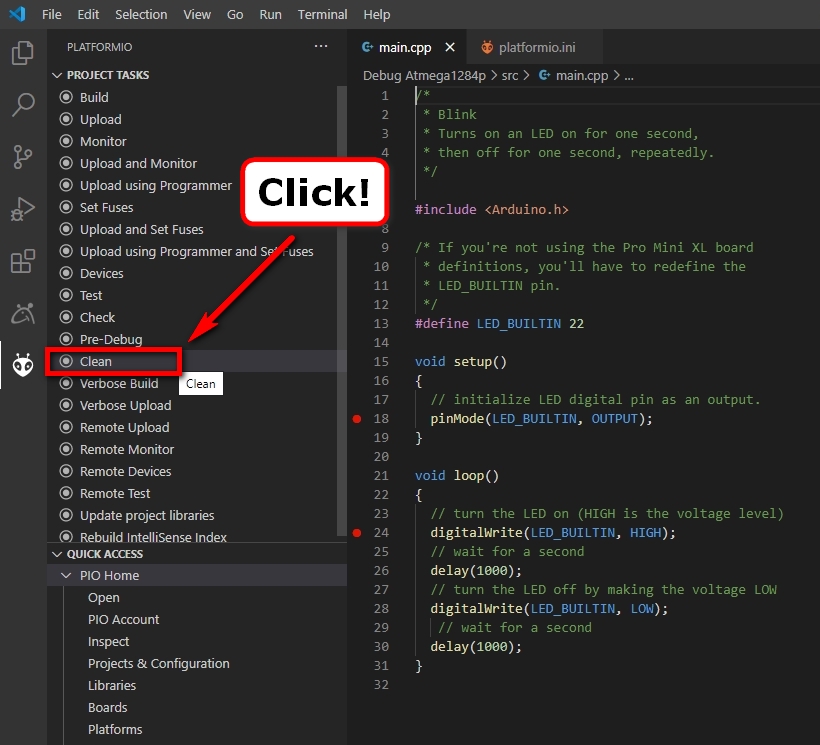
Step 14: First, clean the project of any previously compiled object files, etc.
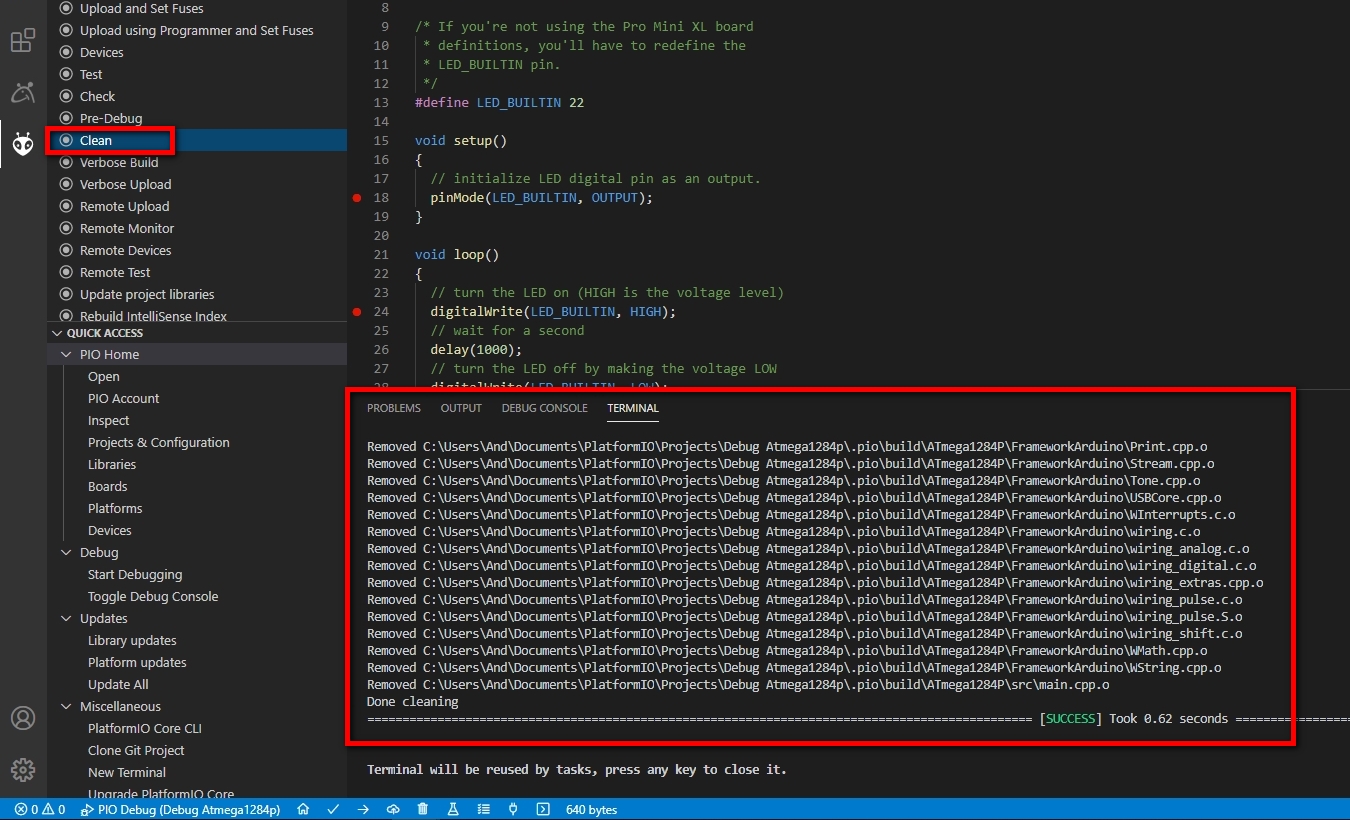
Assuming this task completes successfully, you should see something like the following in the terminal window:
Note: Simply “press any key” as instructed to close the terminal window.
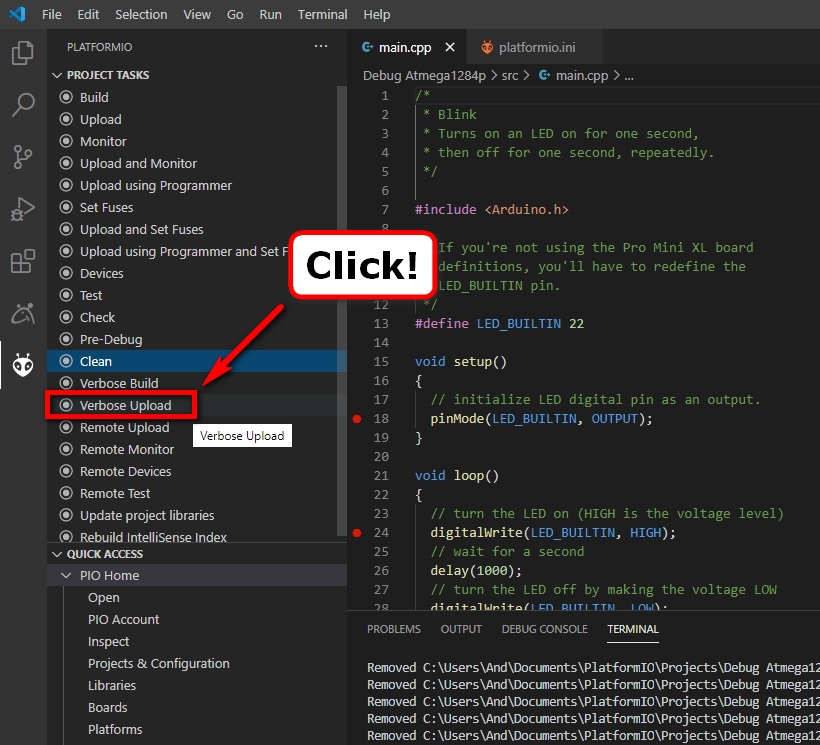
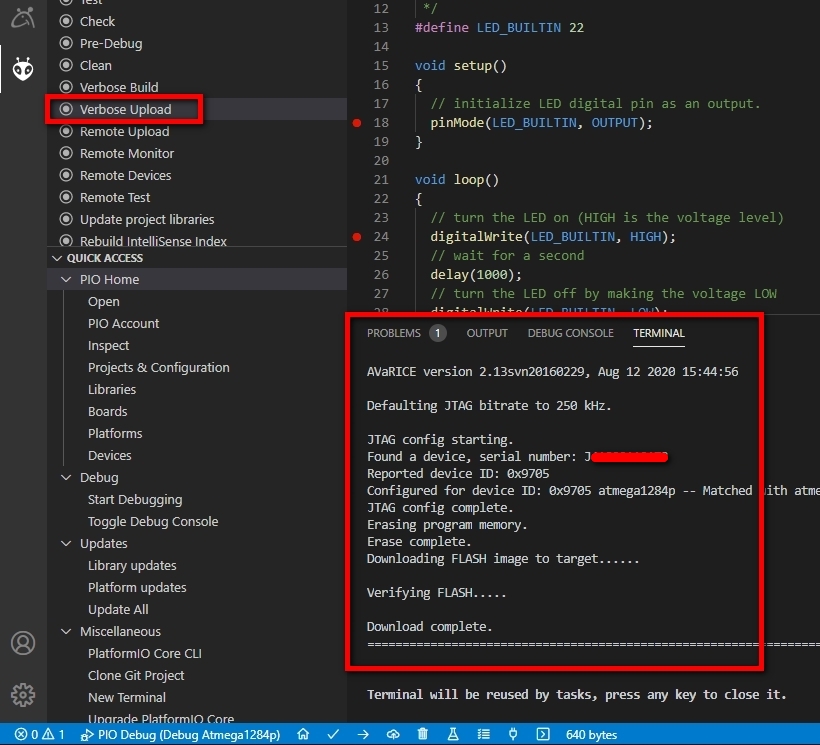
Step 15: Once cleaned, run a “Verbose Upload” task as this should compile the source code with all the debug symbols and then upload that code.
Assuming this task completes successfully, you should see something like the following in the terminal window:
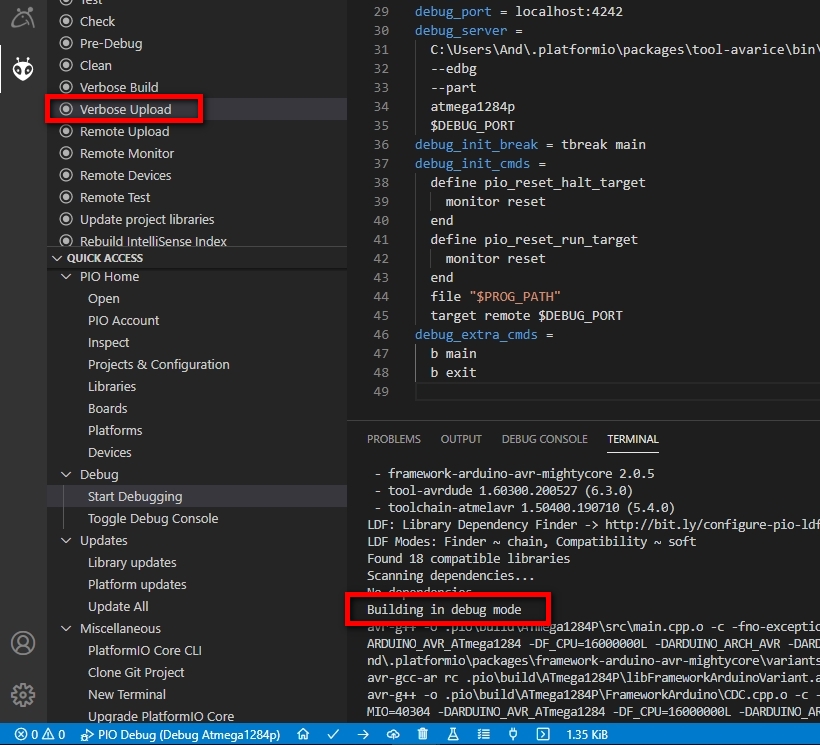
If you scroll up in the terminal, you should see a line that confirms your code has been built in debug mode.
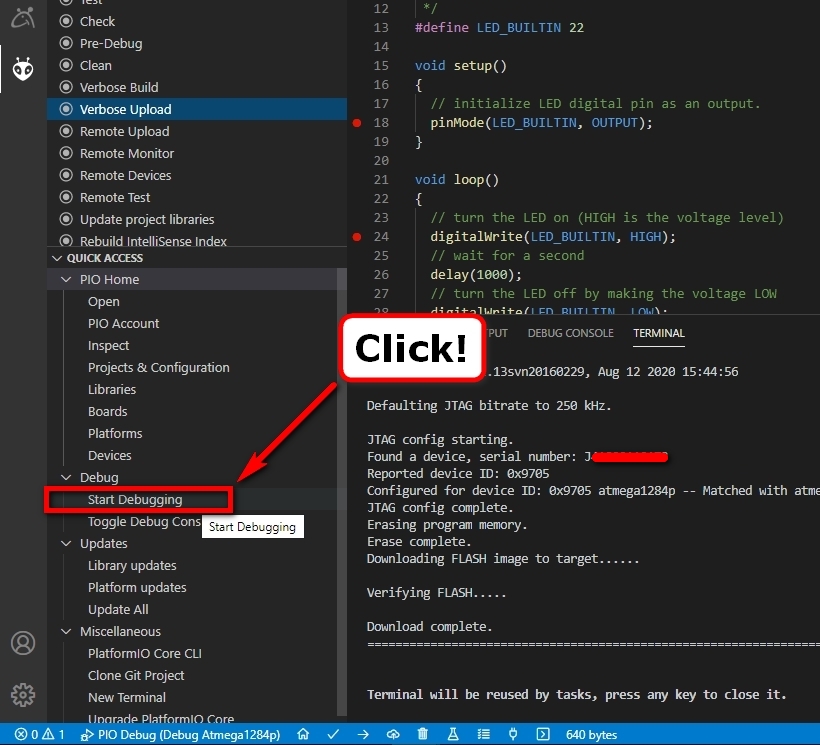
Step 16: Next, launch a debugging session by clicking on the “Start Debugging” task, or simply press F5.
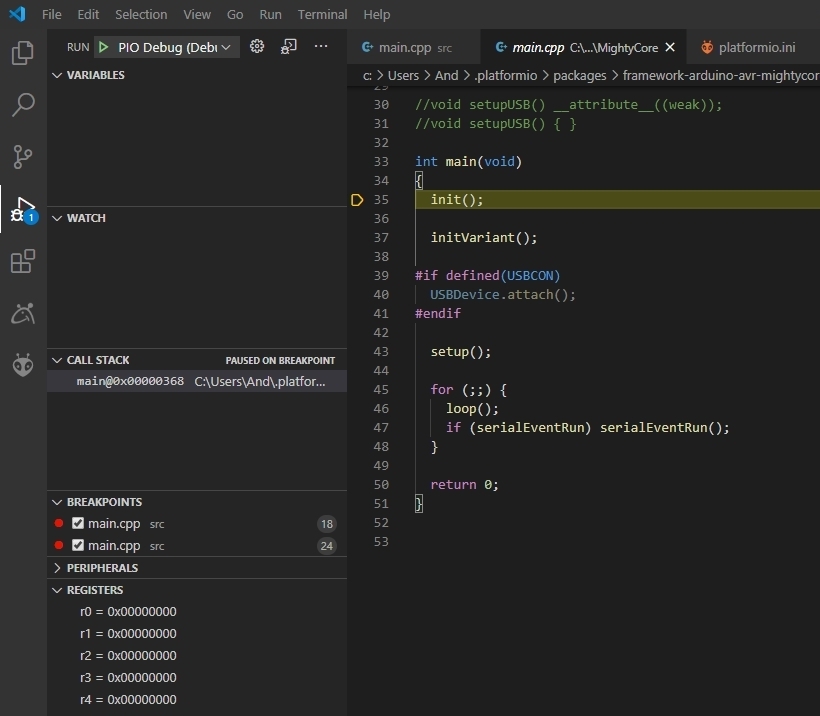
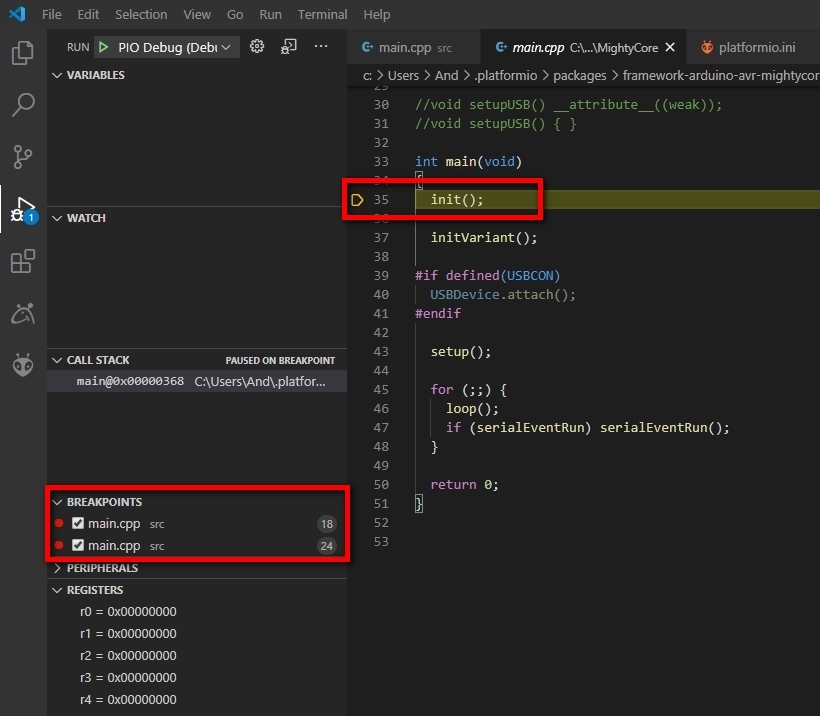
Assuming all goes well with launching AVaRICE and GDB, you should see something like the following:
In the above screenshot, you should see two breakpoints already listed under the “BREAKPOINTS” section – these are the two selected before in Step 12.
You should also see that the debugger has already stopped the Atmega1284p on the first line of main.cpp.
This is one of the temporary breakpoints (tbreak) set in the configuration options from Step 11.
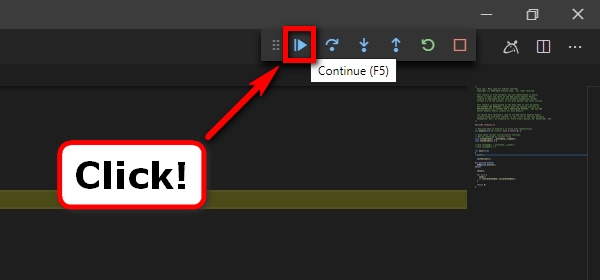
Step 17: Click the Continue button or type “Cont” in the “DEBUG CONSOLE” to begin executing your compiled code on your Atmega1284p:
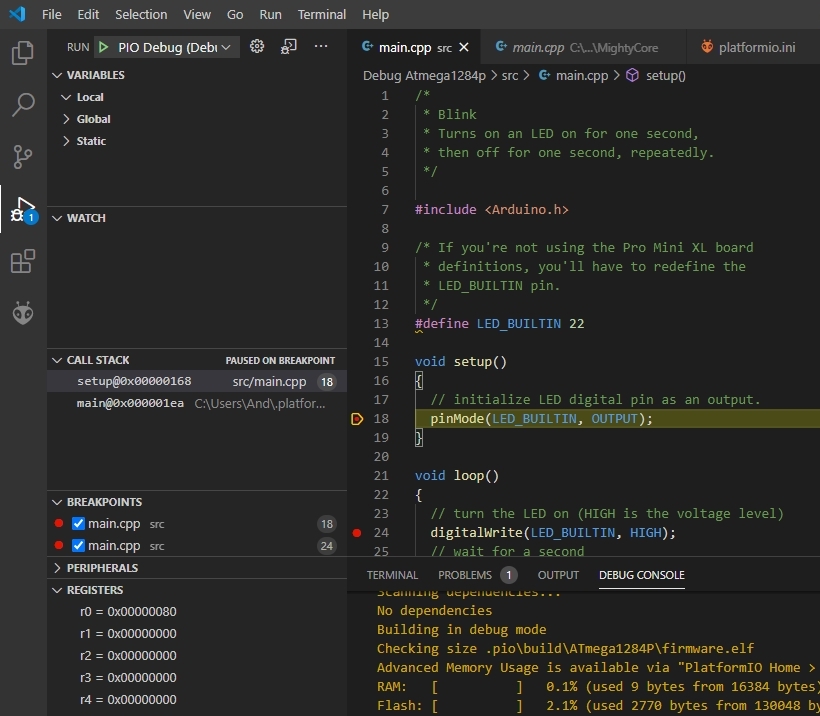
This will continue code execution on the Atmega1284p until it hits your first breakpoint.
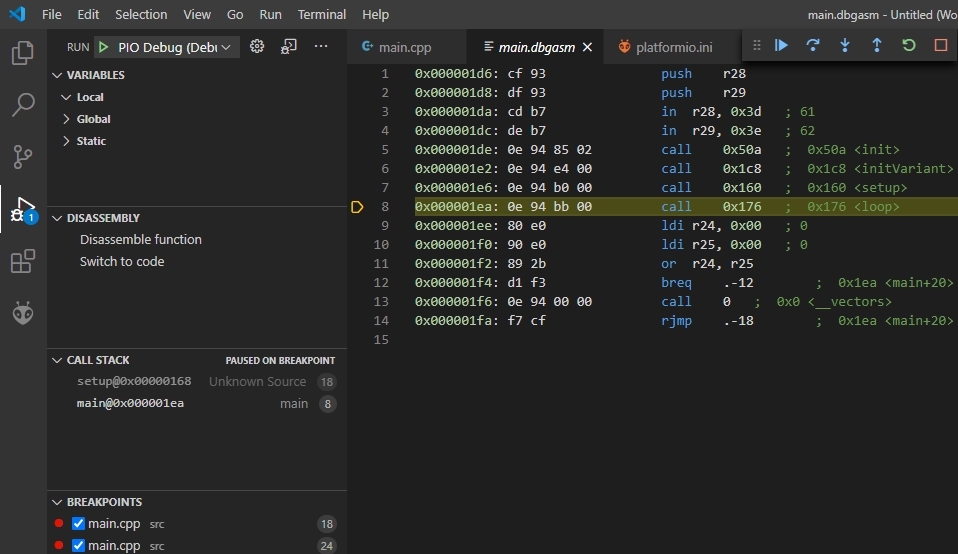
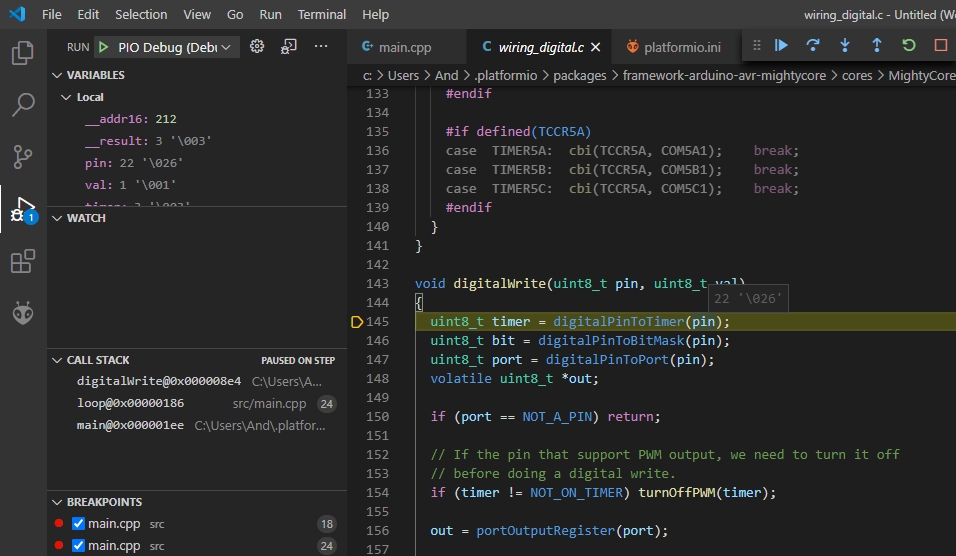
From the debug interface, all the usual debug operations are possible, such as stepping into or over code, or view the disassembly:
Or hover over and watch variable values in the code:
Or view the memory map:
For more information on using PlatformIO’s debug interface please see their documentation.
You should now be able to upload and debug your code through PlatformIO using your Atmel ICE .


From someone who is massively struggling with his new installation of VBC, PlatformIO, ESP-Prog (Debugger hardware) and a new ESP-32 WROOM 32 board (AZ), I appreciate your efforts. Help in any detail whatsoever is very rare! Too much advice assumes that one talks in ones sleep in Hex and pointers, has intimate knowledge of VSC and PlatformIO and knowledge about the finer details of grappling with the two cores in the ESP32. If at any point you become expert in overcoming the “environment”, or care to, I would be eager to tune in.